Startup/VC Metrics - SaaS
January 4, 2021•1,487 words
More personal notes - lifted from the best blogs
Business and Financial Metrics
- Bookings (value of contract) vs. Revenue (recognised when revenue provided) NB Letters of intent and verbal agreements are neither revenue nor bookings.
- Recurring Revenue vs. Total Revenue ARR (annual recurring revenue); ARR per customer: Is this flat or growing?; MRR
- ARR should exclude one-time fees, professional service fees, and any variable usage fees.
- Gross Profit
- Total Contract Value (TCV) vs. Annual Contract Value (ACV)
Re ACV - is it growing, i.e. are you adding more value?
- LTV
- Revenue per customer (per month) = average order value x by the number of orders
- Contribution margin per customer (per month) = revenue from customer - variable costs associated (selling, administrative and any operational costs associated with serving the customer)
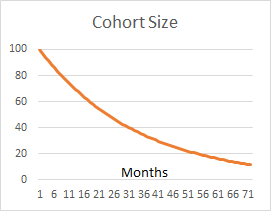
- Avg. life span of customer (in months) = 1 / by your monthly churn.
- Why? When you graph average lifespan of customer against monthly churn, because churn is a % of customers leaning, you have an exponential decay graph.
- LTV = Contribution margin from customer x by the average lifespan of customer.
Gross Merchandise Value (GMV) vs. Revenue
GMV (how much the consumer side of the marketplace is spending) as measure of the size of the marketplace.Unearned or Deferred Revenue and Billings
SaaS companies only recognize revenue as the service is delivered, so that “booking” is a liability line item called deferred revenue.
Billings is a much better forward-looking indicator of the health of a SaaS company than simply looking at revenue because revenue understates the true value of the customer, which gets recognized ratably.
A SaaS company could show stable revenue for a long time — just by working off its billings backlog — which would make the business seem healthier than it truly is.
CAC (Customer Acquisition Cost) … Blended vs. Paid, Organic vs. Inorganic
Product and Engagement Metrics
- Registered Users (vanity)
- Active Users definitions
- In social and mobile platforms: MAUs, WAUs, DAUs, and HAUs
-On content sites: “uniques” and visits
-On e-commerce sites: no weight on MAU/DAU
- In social and mobile platforms: MAUs, WAUs, DAUs, and HAUs
-On content sites: “uniques” and visits
- Month-on-month (MoM) growth
- CMGR [CMGR = (Latest Month/ First Month)1/# of Months -1] also helps you benchmark growth rates with other companies.
Churn: Monthly unit churn = lost customers/prior month total
Retention by cohort
- Month 1 = 100% of installed base
- Latest Month = % of original installed base that are still transacting
Gross churn: MRR lost in a given month/MRR at the beginning of the month.
Net churn: (MRR lost minus MRR from upsells) in a given month/MRR at the beginning of the month.
- Gross churn estimates the actual loss to the business, while net revenue churn understates the losses (as it blends upsells with absolute churn).
Burn Rate: Monthly cash burn = cash balance at the beginning of the year minus cash balance end of the year / 12
- Net burn [revenues (including all incoming cash you have a high probability of receiving) – gross burn] is the true measure of amount of cash your company is burning every month.
- Gross burn on the other hand only looks at your monthly expenses + any other cash outlays.
Downloads (but a vanity metric)
Business and Financial Metrics
Total Addressable Market (TAM)
- But using the size of an existing market might actually understate the opportunity of new business models:
- Bottom-up analysis, preferred, which takes into account your target customer profile, their willingness to pay for your product or service, and how you will market and sell your product.
- But using the size of an existing market might actually understate the opportunity of new business models:
Average Revenue Per User (ARPU)
For pre-revenue companies, investors will often compare the prospects of a company against the known ARPU for established companies. For example, we know that Facebook generated $9.30 ARPU in FY2015Q2 from its U.S. and Canada users.Gross Margins
A few examples to illustrate the point: E-commerce businesses typically have relatively low gross margins, as best exemplified by Amazon and its 27% figure.- cf most marketplaces (note here the distinction between e-commerce) and software companies should be high gross-margin businesses.
Sell-Through Rate & Inventory Turns
- Sell-through rate :number of units sold in a period divided by the number of items at the beginning of the period
- In marketplace businesses: like high + improving rate so that suppliers are seeing good returns on the effort they put into posting listings on the marketplace.
- In businesses that buy any kind of inventory — retailers, wholesalers, manufacturers — the sell-through rate is a key operating metric for managing inventory on a weekly or daily basis. It can reveal how well you matched supply of your product to demand for it, on a product-by-product basis.
Inventory turns is a more useful metric than sell-through rate in inventory-based businesses, because it:
- Talks to the capital efficiency of the business
- Provides clues as to the quality of the inventory, i.e. demand
- Provides clues as to the quality of the inventory, i.e. demand
- Talks to the capital efficiency of the business
Economic and Other Defining Qualities
Network Effects shown by, e.g.
- The sales productivity of OpenTable grows substantially over time, as large increases in the number of inbound leads.
- The number of diners seated at existing OpenTable restaurants grows substantially over time.
- The share of diners who come directly to OpenTable to make their reservation (versus going to the restaurants’ websites) grows substantially over time.
Virality is the speed at which a product spreads from one user to another.
- NB viral growth does not necessarily indicate a network effect.
- Virality is often measured by the viral coefficient or k-value:
- Here’s the basic math behind the k-value [there are some other more nuanced and sophisticated calculations here]:
- Count your current users.
- Multiply that count by the average number of invitations that your user base sends out.
- Figure out how many of those invited users took the desired action within a defined period of time. As with all measurements, pick a meaningful metric for this action. =. This means you started with 1,000 people and ended up with 1,750 people through this viral loop during your defined time period. The viral coefficient is the number of new people divided by the number of users you started with; in this case, 750/1000 = 0.75.
- Count your current users.
- Anything under 1 is not considered viral; anything above 1 is considered viral.
Economies of Scale, e.g. decreasing unit cost over time.
Other Product and Engagement Metrics
Net Promoter Score (NPS):
1. Ask your customers the above question and let them answer on a 0-to-10 Likert-type scale, with 10 being definitely likely
2. % of promoters = number of respondents who ranked 9 or 10, divided by total number of respondents
3. % of detractors = number of respondents who ranked ≤ 6, divided by total number of respondents
4. NPS = % of promoters minus % of detractors- Obvious issues: only surveying a subset of customers, comparing companies, which leads to misunderstanding and gaming scores. Rather, focus on same company NPS trends — and pay close attention to optional comments from users.
- When looking at NPS, we look for a couple of things:
Cohort Analysis
- Cohort analysis breaks down activities/ behavior of groups of users (“cohorts”) over a specific period of time that makes sense for your business — for example, everyone who signed up for your service in the first week of January — and then follows this group of users longer term: Who’s still using your product after 1 month, 3 months, 6 months, and so on?
- Here are the steps for a cohort analysis:
- Pick the right set of metrics rather than a vanity metric (like app downloads)
- Pick the right period for a cohort — this will be typically be a day, a week, or a month depending on the business
- Period 1 (day, week, or month) — 100% of install base takes some action that is a leading indicator for revenue, such as buying a product, listing a product, sharing a photo, etc.
- Period 2 — calculate the % of install base that is still engaging in that action a week or month later
- Repeat the analysis for every subsequent cohort to see how behavior has evolved over the lifetime of each cohort
-The two trends we like to see in cohort analyses are:
1. Stabilization of retention in each cohort after a period such as 6 or 12 months.
2. Newer cohorts performing progressively better than older cohorts.Sources of Traffic
Customer Concentration Risk: revenue of your largest customer or handful of customers relative to total revenue. So if your largest customers pay you $2M/year and your total revenue is $20M/year, the concentration of your largest customer is 10%.