Finding bottlenecks in your python app
June 19, 2021•796 words
"Early optimization is the root of all evil." is a common mantra in Software Engineering.
Why profiling?
Optimizing for a specific computation when the bottleneck is at the network level isn't the best use of your time. How do you find out which module needs a critical redesign, a better choice of algorithms, or data structures?
You can use your intuition and test the water using a few print statements here and there. Let's say you time a DB operation against an image processing task to see which one needs some efforts first, comparing both execution time can help prioritize your energy but this severely risks seeing only a part of the picture if the dominant term for your program congestion is instead the API authentification flow.
In a nutshell, It's easy to make wrong assumptions about your system bottlenecks and invest lots of time and effort for marginal performance gains. You need a systematic way to assess the resource usage of your app.
That's exactly what profiling is about.
A brief note on monitoring vs profiling:
- Monitoring your system is about having metrics on the health of your system in prod in (as close as possible to) real-time. You can monitor the CPU usage, memory, bandwidth, number of incoming requests, errors, etc.
- Profiling is about identifying resource consumption of the different functions and instructions of your program. Think of profiling as doing a live dissection on your service to look into its deepest internals. From the high-level API calls to library functions, deep down to OS-level operations like read/write. You usually profile your program when the prototype is working and you're looking for the most critical element to optimize, if necessary.
Profiling is particularly useful when you have no clue over what could be your system bottleneck. Start your program, profile it with a typical workload, visualize the profiling report, and voilà. You now know it's this sneaky image serialization task you didn't even suspect that's taking way too long!
Note that you can profile different metrics, like run time or memory, depending on your needs.
Profiling your python app
Fortunately, we have several profiling tools readily available for use in python. Among them, cProfile and py-spy
- cProfile comes from the Python Standard Library. One drawback of
cProfileis the non-negligible footprint it has on the actual code you want to monitor. You're likely to have to change the source code of your Python app to profile it withcProfile. For instance, by adding a context manager (available since Python 3.8) like so
import cProfile

with cProfile.Profile() as pr:
    # ... do something ...
- py-spy is a third-party library with 7K GitHub ⭐️ at the time of this writing which seems surprisingly low to me given how well it works and the problem it solves. The big advantage of
py-spyovercProfileispy-spyability to profile your app without changing the python source code at all. It's almost too good to be true, right? This comes at a high-security price,py-spyneeds to have lots of privilege on the host to get the information over the process it will profile.
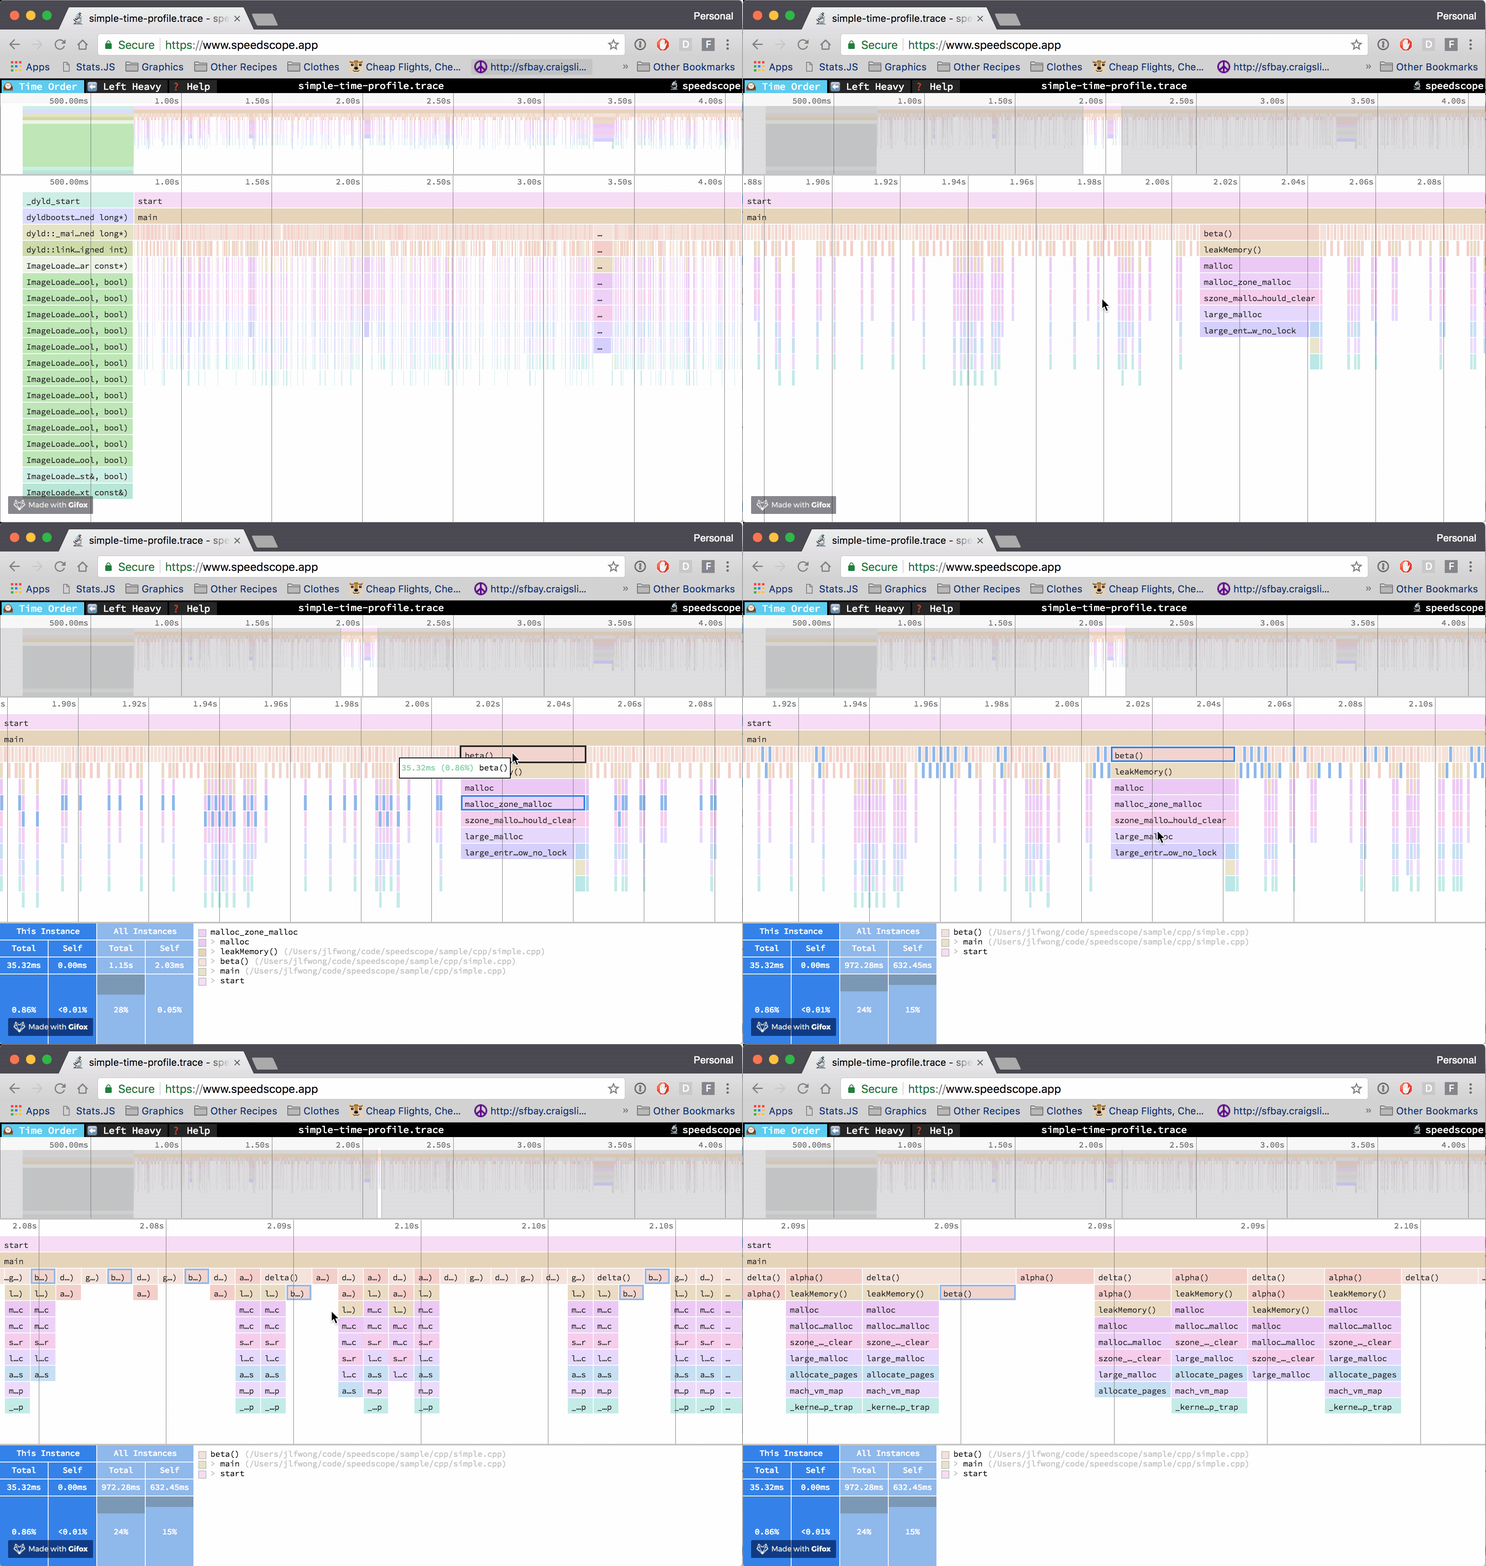
Note that both cProfile and py-spy generate a profiling report that is rather dull and hard to interpret past the dozen of functions in your program. Luckily for us, the open-source community offers strong tools to help you visualize those reports, I'm thinking about the beautiful speedscope app for profiling results visualization.

Example of profiling result visualization with the speedscope app, source: https://github.com/jlfwong/speedscope
Profiling your python app running in docker
py-spy proposes a convenient way to profile python apps running within a docker container, it's even easier if you're using docker-compose.
This blog post from Jan Pieter Bruins Slot does a nice job at proposing a minimum working example of how to profile your python app through docker.
Note that I'd recommend dropping thepy-spy service from your production docker-compose.yaml. If it's ok to pay the security price of enabling the SYS_PTRACE capacity to enable a container to read process memory in a dev environment, that has little benefits in prod but expose you to potential security risks.
To address this, you can maintain two docker-compose files:
- One for your dev environment
dev.docker-compose.yamlwith apy-spyservice - And another docker-compose file for your prod without the
py-spyservice, yourprod.docker-compose.yaml
Wrap up
- Profiling is not so hard in python!
- Our intuitions for optimizations are often wrong.
py-spyand the speedscope app even make it fun to explore the call stack!- Profiling helps you get a better understanding of the order of magnitude of the different tasks of your pipeline.